

Numbers can tell many stories. Build yours
Benchmarks moved in a few decades from a specialty niche hosting rain makers and rare experts to a broadly used tool available online, with many competing for the same business. Little exist in terms of standards and tools however to fully leverage the value of the reports and analysis.
On the customer side, everybody is now using benchmark values a way or another, picking bits and pieces of knowledge to form an opinion. The inevitable bias creates a new version of truth and can overcome deeper analysis with greater formatting.
Technology benchmarks are sometimes based on a recent quarter’s data. Some collect thousands of inputs, while others are processing a mere couple of hundred records. Resetting benchmark data from the perspectives of time (how adequate is the data gathering period) and relevance of the sample group (how similar are the companies or businesses being surveyed) is a necessary process to make the best use of the intelligence gathered.
Like any tool, the value of a benchmark is in how it is being used. A composite competitive or comparative benchmark index can provide targeted information to match strategic endeavors: competitive performance and how the peer group responds to market changes; specific competitor’s numbers and how they compare; how much a strategic initiative or corporate program achieves business value over time. For each application, a specific composite panel can be built and monitored.
The need for perspective… and a bit of math!
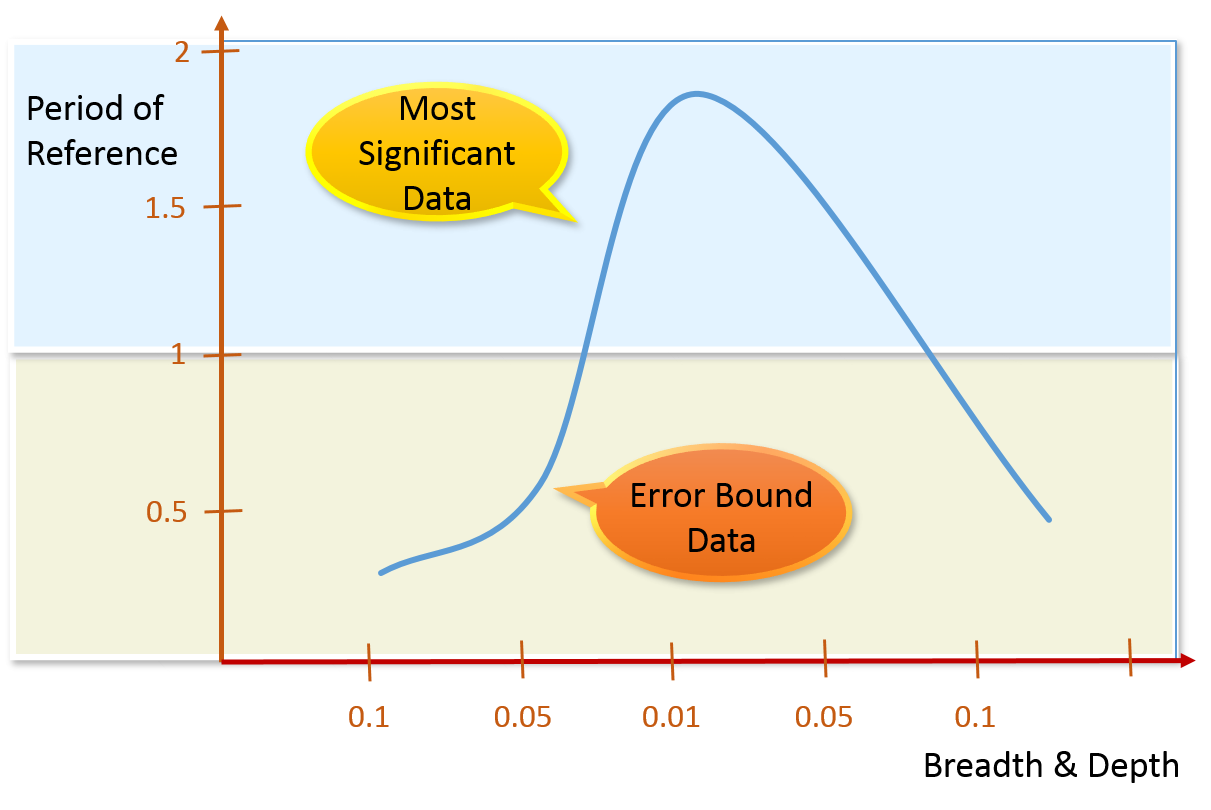
Whether the benchmark is the result on internal collection or a purchased product, the results should always be placed into a fresh, skeptical perspective, to make sure that the relevance and accuracy of the data is going to match the needs. Two dimensions: period of reference and the proportion (breadth & Depth) of the sample base, should always be used to validate how much you can rely on the calculated numbers to make decisions. Using a sample base of at least 400 independent points can provide a 95% confidence level, and a period of reference of at least the same duration as your decision / analysis covers are safeguards. They might not ensure that you have the right answer, but might help you avoid the biggest mistakes. A reduction of the sample data size is not always a source of error, as long as the sample size remains within acceptable confidence level (10% seems a good threshold), and that the period is not smaller than the target analysis.
Composite benchmarks that fit your needs
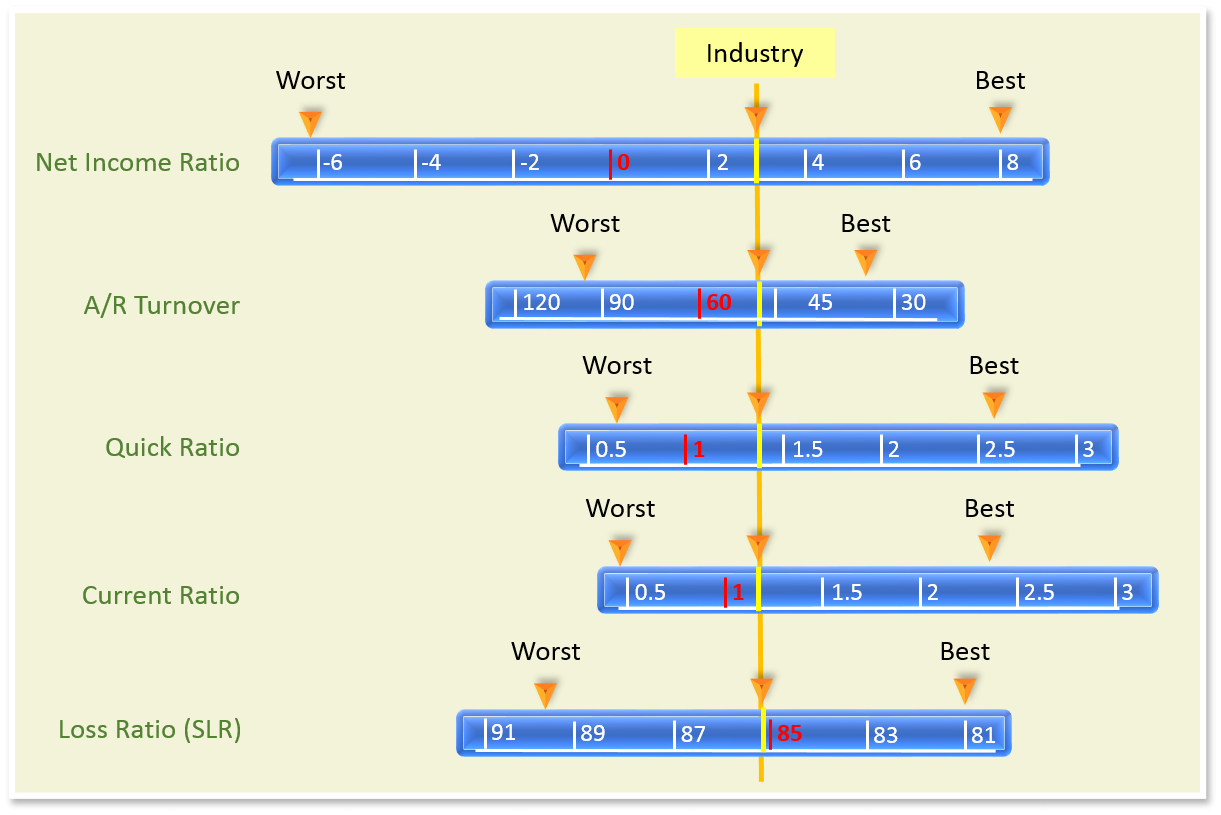
The comparative analysis of the performance of a business with its peers is a precious tool to know when and where one is doing better than others, which by itself provides both a goal to achieve and an understanding of the competitive differentiator. A limited number of performance indicators are in general providing a solid perspective of the overall competitive performance: revenue, net profit, turnover, COGS, EBITDA, Gross Margin, SG&A, etc. For each business, a specific set of Key Performance Indicators are meaningful, such as the Underwriting Cycle Time or Abandonment Rate in the Insurance industry. Once a set of indicators is created, the central value should be the industry average for a given industry or sub-segment; this is the baseline.
Three additional plotted points can immediately increase the intelligence:
- The best performer (s) in the industry,
- The worst performer(s) in the industry and
- The business doing the analysis.
The following graph illustrates how such a composite benchmark can provide deep intelligence on a segment of the industry, how it reacts to changes to economic conditions or seasonal changes. A simple observation of the changes to the Quick Ratio and Current Ratio in a low-season quarter for example, could give a direct read on the Inventory burden and how each company in the selected group is dealing with turnover.
This snapshot view does not replace a thorough analysis, and each finding should be carefully vetted and correlated; but over time, strategic leaders will gain precious insights signaling patterns and trends. That they take advantage of them is a whole different matter, of course.
Over time, benchmark gathering and analysis offers a view into market trends and into a company’s variances against its peers and the industry. There lays a whole new discipline: competitive performance intelligence. Advanced use of composite benchmarking can be a precious source of dynamic analysis and confirmation of impact for the strategic leader, with relatively little investment up-front besides the procurement of base data.
All you need is a good pocket calculator and a dose of analytical skills, to take advantage of such tool. Add strategic intent or a long term goal to the mix, and you have all you need to make it work for you, while you can look into your next strategic target.
